How my microbiome looks while drinking 6 servings daily
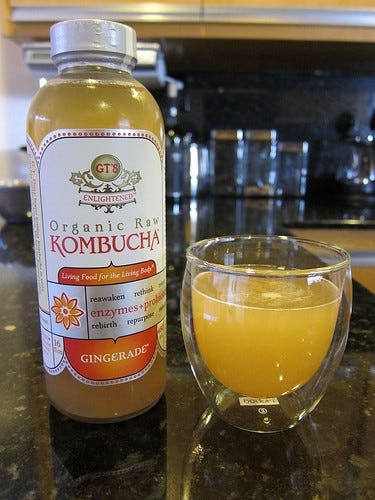
Drink up! (Photo: Neeta Linda)
For healthy bacteria-rich drinks that affect the microbiome, many people immediately think of kombucha. Served chilled during the summer, it has a well-deserved reputation as a natural refreshing alternative to soft drinks. Despite its tangy, mildly sweet taste, it has a surprisingly low amount of sugar: less than two grams in a serving, compared to more than 20 grams in the same amount of orange juice or 39 grams in a can of Coke.
The sugar is missing because it’s been eaten by microbes, a complex blend of bacteria and yeast that convert regular tea (usually black, but also oolong or green tea) into a complex, flavorful beverage. The fermentation process is ideal for adding other ingredients for taste, so there is no end to the interesting flavors possible, giving rise to a highly competitive commercial market: U.S. supermarkets sold $180 Million of the drinks in 2015.
There are many anecdotal claims of the effect of kombucha on health, purporting benefits ranging from better eyesight and thicker hair to cures for various diseases, though not everyone agrees it’s healthy. Many experts, including some alternative health naturopaths like Dr. Andrew Weil, recommend against it. All of the effects, positive or negative, are generally attributed to microbes and have been studied extensively in mice as well as humans, but I’m unable to find any studies showing directly how it affects the microbiome.
So I tested it myself.
For seven days, from July 27 to August 2, I drank 48 ounces per day of commercially-produced GT’s Gingerade Kombucha. That’s three bottles, or a total of six servings a day for a week. What did I learn?
What’s in Kombucha?
To understand what to look for, it’s helpful to review some of the science:
Kombucha fermentation begins with a SCOBY, a “Symbiotic Colony of Bacteria and Yeast”, a pancake-sized disk-shaped gelatinous object also known as a “mother” or “mushroom”, which it sort of resembles. Despite the nickname, the only fungi in the SCOBY are single-celled yeasts combined with a complex blend of bacteria and other microbes from many parts of the tree of life. The different microbes need one another to produce the distinctive sweet and fizzy taste. Yeast cells convert sucrose into fructose and glucose and produce ethanol; the bacteria convert glucose into gluconic acid and fructose into acetic acid; caffeine from the tea stimulates the entire reaction, especially the production of cellulose by special strains of bacteria.
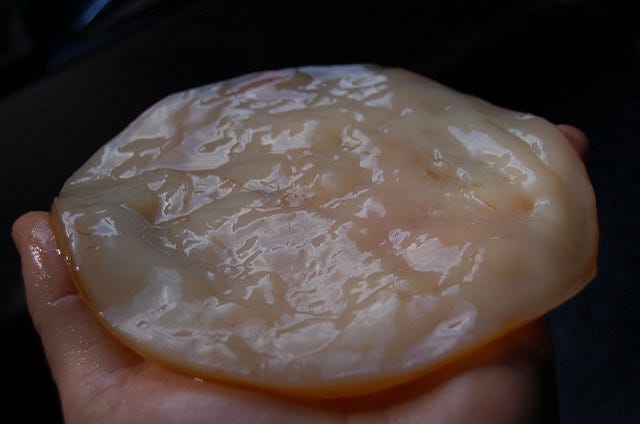
A “mushroom” that’s not a mushroom. (Photo: Jasonunbound)
The key bacteria in the SCOBY are from phylum Proteobacteria and order Rhodospirillales of acetic- and gluconic-acid producting microbes that include genus Gluconacetobacter, closely related to Acetobacter, the key to the fermentation of vinegar. Thanks to the action of these microbes, kombucha is quite acidic, between 2.5 and 3.5 pH, almost as acidic as the 1.5 or 2.5 of a healthy stomach. These bacteria apparently don’t survive ingestion. They are rarely, if ever, found in human guts, so whatever effect, if any, they have on the microbiome is indirect.
The GT’s label says each bottle contains one billion organisms of two microbial species. The first, Saccharomyces boulardii, is a popular “healthy” microbe, well-studied and proven as a safe digestion aid. A close cousin of brewer’s yeast, its cell wall tends to stick to pathogens, which may account for its proven ability to prevent and fight diarrhea. Unfortunately, it is not a bacterium, and so won’t be detectable in my 16S-based microbiome tests.
The other added species, Bacillus coagulans, is often found in human guts, and should be easy to find with my test. The specific one used in GT’s drinks is the patented Bacillus coagulans GBI-30, 6086, a particularly hardy spore-forming microbe that can survive boiling and baking. Because it’s well-studied and safe, it’s a popular “probiotic” food additive and appears to have some beneficial effects on digestion.
My Results
I tested my gut microbiome each day, as well as my mouth and skin microbiome at intervals during the experiment and sure enough, the Bacillus shows up loud and clear.
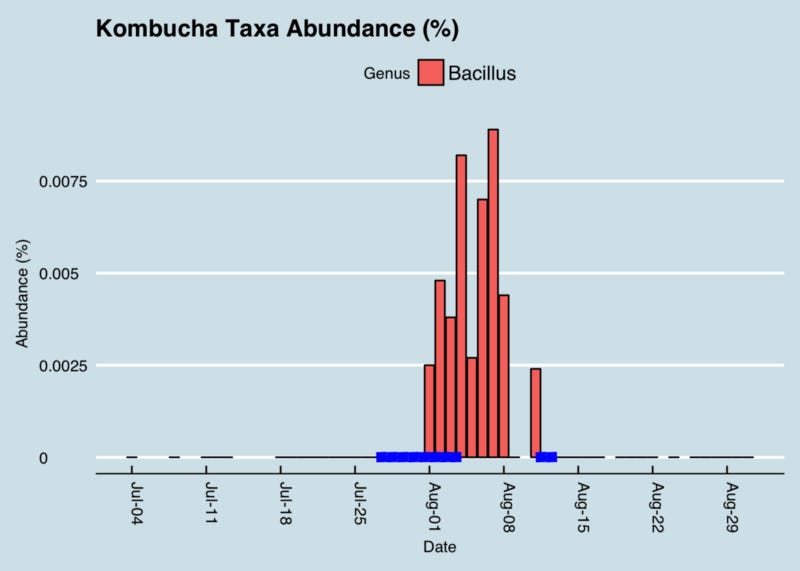
That’s a lot of Bacillus. The blue line represents days I drank 6 servings of kombucha.
It took a few days of heavy kombucha drinking, but eventually those microbes became detectable. Given the known hardiness of Bacillus, this isn’t necessarily all that surprising, but it’s a nice confirmation that the test works; after all, in my hundreds of daily tests, I see this microbe only in the few days after drinking this brand of kombucha. But maybe the Bacillus just comes in and out, safely protected as a spore, without really influencing my microbiome. Can we see evidence the kombucha affected something else about my microbiome?
Diversity doesn’t seem to change. I looked at the overall mixture of microbes and abundances using the Shannon diversity metric, commonly used by ecologists to measure the richness and variety in an environment. I set the scale of this graph very narrowly to see precisely how diversity changes each day, but don’t let that the exaggerated ups and downs fool you: a Shannon diversity change of a tenth of a point or so is pretty trivial.
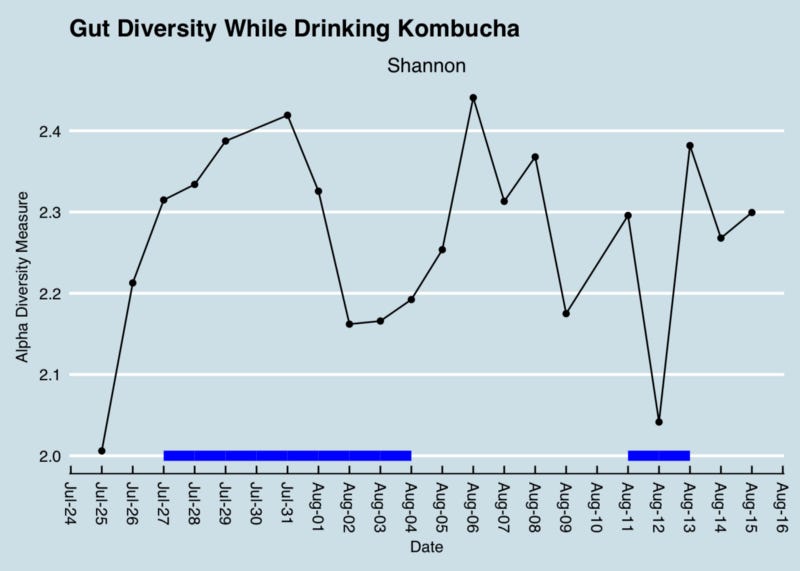
My overall gut diversity measured by the “Shannon” index (family-level). Blue lines are days I drank kombucha.
Diversity had been climbing before the experiment began, so I don’t think we can lay that initial increase on kombucha. It’s important to note that, had I not been testing daily, I might be tempted to say diversity decreased. (By the way, note that the July 30 sample is missing, due to a failure in the lab processing; that second blue line in mid-August )
What about order Rhodospirillales, the one that contains the genus Acetobacter found in the SCOBY? It would be highly surprising if amounts of this microbe made it all the way from the SCOBY used during the commercial brewing process, through the stomach and gut, and then to my 16S test, but let’s check:
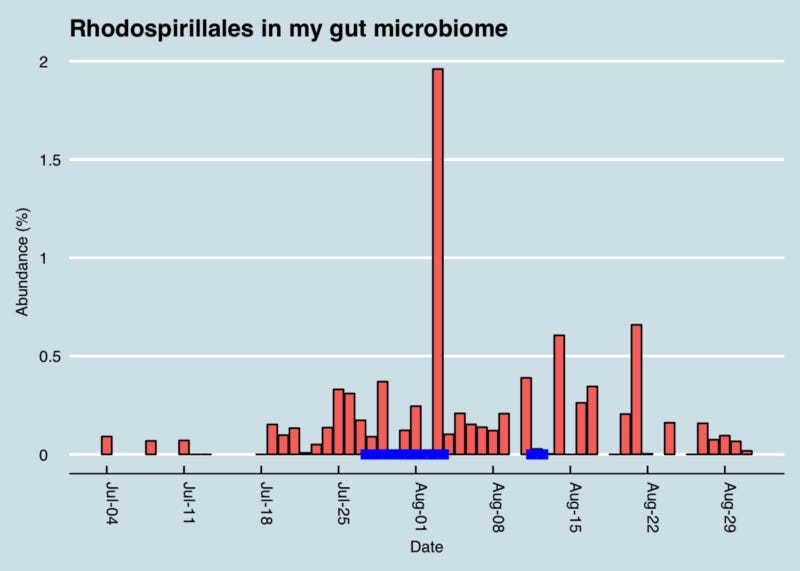
Abundance of microbes that include the genus Acetobacter from the SCOBY.
Wow, that’s a pretty big increase! If we squint enough, we might credit that large spike with kombucha drinking. It’s possible, but then how would you explain the crash the following day, or the other apparent spikes in other parts of the chart? I conclude it’s probably a coincidence. More than likely, microbes like this from the SCOBY itself are not in the beverage anyway.
To see other trends, sometimes it’s nice to plot the abundance data as a heatmap showing the changes of the top 20 genera (i.e. microbes at the genus level) during my experiment. This is a graphical way to make it easier to spot trends in large amounts of numerical data like the abundance information from a week’s worth of microbiome tests. Darker shades are lower abundance and lighter shades are higher. To find patterns, look from left to right for consistent shading changes, either sudden or gradual, that might indicate a microbiome shift caused by the kombucha.
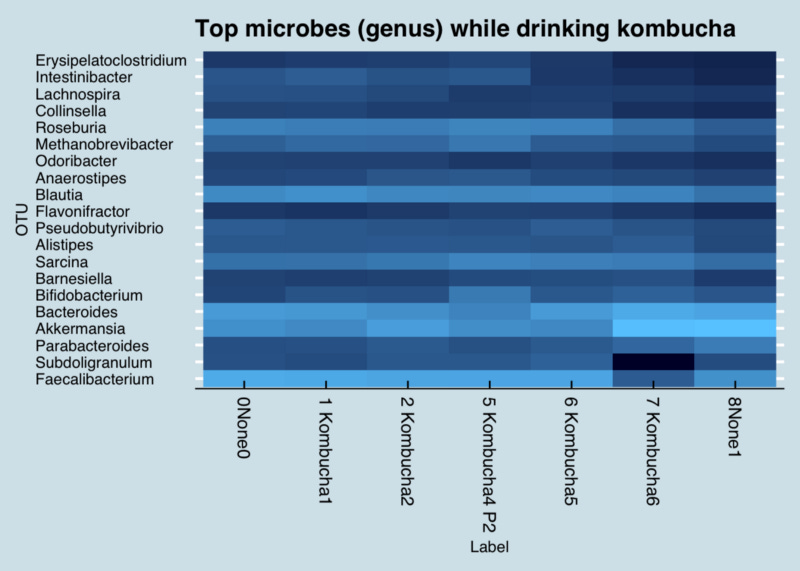
Heatmaps like this, while a crude way to find patterns, can help spot highly obvious shifts. I don’t pretend to be an expert at reading this, but to my eyes I don’t see any obvious changes one way or another.
Maybe the changes will be more visible if we look at specific microbes. Here are the abundance levels of a few that are commonly thought of as “probiotic” or “healthy”. Again, it’s a crude measure, but people pay big money for probiotic supplements that contain these bacteria, so it would be impressive if the results showed an obvious change while drinking so much kombucha.
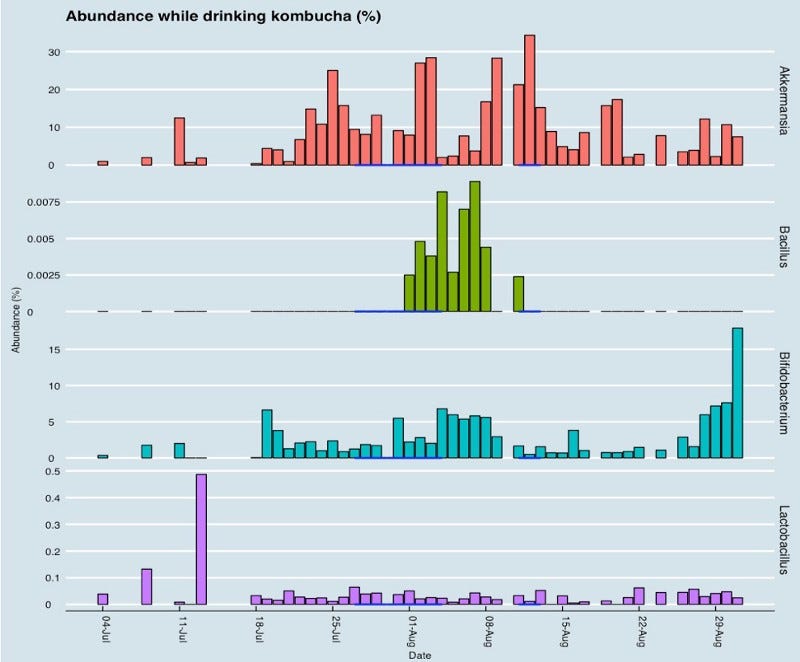
Daily abundance of key microbes while drinking kombucha (blue lines). Blank regions are days with no data.
See any patterns? Other than the Bacillus, I’m afraid you’d need a pretty good imagination to pretend the kombucha had any effect.
Conclusion
When consumed in large amounts, GT’s Gingerade Kombucha leaves new Bacillus microbes in my gut. Although they don’t appear to stick around permanently, the association is strong enough that I bet it works in you too. Other microbes, including so-called “probiotic” ones, don’t change much at all.
But don’t take my word for it. The full dataset and analysis tools are on Github: https://github.com/richardsprague/kombucha
If you like this and my other microbiome posts, please ‘clap’ here on Medium and then follow our Facebook page, where we’ll be making an announcement soon about how you can learn more about your own microbiome.
References
Dufresne, C, and E Farnworth. 2000. “Tea, Kombucha, and Health: A Review.” Food Research International 33 (6). Elsevier: 409–21.
Greenwalt, C. J., K. H. Steinkraus, and R. A. Ledford. 2000. “Kombucha, the Fermented Tea: Microbiology, Composition, and Claimed Health Effects.” Journal of Food Protection 63 (7): 976–81. doi:10.4315/0362–028X-63.7.976.
Vīna, Ilmāra, Pāvels Semjonovs, Raimonds Linde, and Ilze Deniņa. 2014. “Current Evidence on Physiological Activity and Expected Health Effects of Kombucha Fermented Beverage.” Journal of Medicinal Food 17 (2): 179–88. doi:10.1089/jmf.2013.0031.
Originally published at richardsprague.com on December 14, 2017.


